Lightning and Electric Field

Rome


Scandriglia

Electromagnetic Field monitors updated every 2 mins with a time span of 30 min.

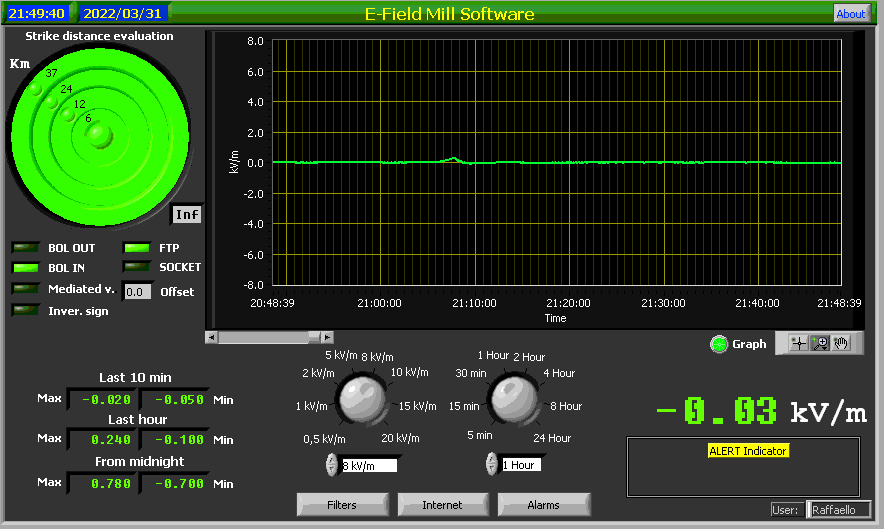
The circles on the upper left corner of the displays show the distances of the strikes occurred near the observing sites.

The ALERT indicator in the lower right corner gives the same information of the circles in the map image.


The circles show the Electric Field area of 50Km with center on Rome and Scandriglia. There is also a layer that show the cloud cover and the rain rate prediction: the output of the model studied by Michele de Rosa, Raffaello Di Martino, Alessandro de Rosa e Paolo Marrone 


Green circle = low E.F. < 1 kV/m
Yellow circle = high E.F. 1 <> 5 kV/m
Red circle
= very high E.F. > 5 kV/m

Last MSG image